
Many traders, especially beginners, get caught in the loop of searching for the “best trading strategy.” They see a KOL sharing a setup, a YouTuber posting an RSI crossing MACD chart, or a TikTok video claiming “indicator with 90% win rate,” and immediately apply it without understanding what problem the indicator was designed to solve, in which context, or for what type of trader.
The result is a vicious cycle:
New setup → a few winning trades → a few losing trades → switch to another indicator → lose again.
It’s not because they are bad traders. It’s because they are copying someone else’s system without knowing which indicators actually fit their style.

1.Why You Should Not Copy Other People’s Indicators
This is the most common mistake for retail traders, and it applies to your entire trading system, not just indicators. We often read analyses from top traders and apply them mechanically. But nobody tells you:
- That KOL might trade 4-hour or daily charts where noise is low and trends are clear.
- You might trade M15 or M5, where trends are noisy and you want quick profits.
They may also use price action, support and resistance zones, or volume filters, but their video only mentions RSI.
Most importantly, they have discipline, experience, and capital management, while you might not.
In trading, no method or indicator is magical. An indicator is simply a data filter calculated from price, volume, and time. If you don’t understand what the data is telling you, you are reacting to signals without understanding why.
Indicators do not generate profit. How you use them generates profit.
Instead of searching for the “best indicator,” ask:
What information does this indicator give me?
If it doesn’t help you make more accurate decisions or fit your trading style, it is just decoration on your chart.
2.What Is an Indicator? Its Origin and How It Works?
Indicators are statistical tools that process price data (OHLC of each candlestick), apply mathematical formulas, and display results visually as lines, bands, or oscillators. They help you understand trend strength, momentum, and potential reversals.
Indicators are generally divided into four main groups:
- Trend indicators: MA, MACD, ADX – show direction and strength of a trend.
- Momentum indicators: RSI, Stochastic, CCI – measure price acceleration or deceleration.
- Volatility indicators: Bollinger Bands, ATR, Keltner Channel – measure the range of price movement.
- Volume indicators: OBV, MFI, Volume Profile – measure the strength of money flow.
Knowing which group an indicator belongs to helps you understand the type of information it provides. Misusing indicators, such as stacking multiple trend indicators or conflicting signals, creates noise and misinterpretation, leading to inevitable losses.
3.How to Choose Indicators That Fit Your Trading Style
Many traders pick indicators based on intuition or because a KOL uses them without understanding why. The result is inconsistent trading and difficulty evaluating performance. Only when you clearly understand your style, timeframe, and goals can indicators become effective tools.
3.1 Before asking “Which indicator should I use?” ask “What type of trader am I?”
- Trend follower: targets long swings → use MA, MACD, ADX.
- Mean reversion trader: prefers catching reversals → use RSI, Stochastic, Bollinger Bands.
- Breakout trader: rides momentum → use Volume, OBV, Momentum indicators.
- Scalper/intraday trader: needs quick reactions → prioritize short EMAs, VWAP, CCI.
There are no good or bad indicators, only those that are suitable or unsuitable for your system.
An effective system does not need many indicators. It needs consistent logic:
- Understand the market type you are trading (trend, range, volatility).
- Have clear entry and exit rules.
- Manage risk strictly and maintain stable psychology.
Indicators provide information. They are not the deciding factor in trade outcomes.
3.2 How to Use Indicators Correctly
Most traders never understand the formulas or principles behind the indicators they use. They apply them mechanically and then wonder why results fall short.
The truth is:
- Indicators do not tell you when to buy or sell.
- They do not truly indicate overbought or oversold conditions.
- They only compare current data to historical data.
Do not treat indicators as traffic lights. Treat them as a map of market action:
- Who controls the market – buyers or sellers?
- Is the market sideways or trending?
- Is momentum strengthening or weakening?
When you understand this, you stop “waiting for signals” and start reading the market like a story. Indicators do not decide for you. They provide data for informed, logical decisions.
3.3 Evaluating Reliability and Backtesting Indicators
No indicator is accurate in all circumstances. Professional traders do not seek perfection. They understand when an indicator gives false signals and why.
Examples:
- Moving Average works well in trending markets but fails in sideways conditions.
- RSI indicates overbought/oversold, but in a bull market it can stay above 70 for months.
- MACD is lagging, causing late entries.
- Volume indicators are noisy in low-liquidity altcoins.
How to test and backtest indicators?
- Check repainting: capture signals on a chart, change timeframe, see if signals disappear or shift. If they do, the indicator is unreliable.
- Check lag: ensure signals appear in a timely manner. For example, a breakout signal after price has already moved 5% may need adjustment.
- Backtest sufficiently: at least 100–200 real trades, assess win rate, profit factor, drawdown.
- Test in relevant market conditions: trending, sideways, or high-volatility.
- Consistency across timeframes: stable signals across different timeframes is a plus.
- Objectivity: indicators must provide quantitative data, not subjective guesses.
Key points:
- All indicators lag because they rely on historical data. The goal is not to remove lag, but to understand how much lag still gives an edge.
- Reliability is not about “beautiful charts” or “KOL promotion” but how the indicator reacts in real conditions.
- Treat indicators like radar – identify danger zones and general trends, but your decisions determine entry and exit.
3.4 How to Combine Indicators Effectively
The most common mistake, especially for beginners, is using too many indicators. A chart full of colors does not make your analysis better. It creates noise, conflicting signals, and indecision.
Principle: each indicator should solve a specific problem.
Example of a minimalist but effective setup:
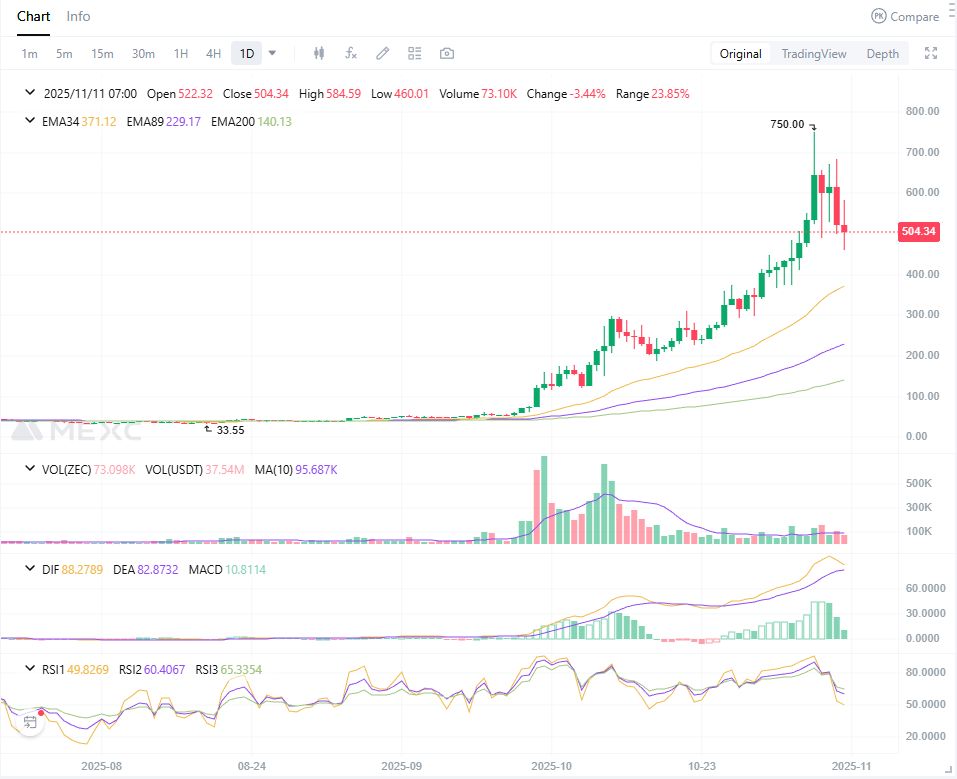
- Trend: EMA 34/89 → defines market direction.
- Momentum: RSI → measures strength of moves.
- Volume: OBV → confirms money flow.
- Price action / zones: determines entry points.
Stop at what is necessary. If five indicators all say “buy,” you are just looking at the same data five ways. The simpler the setup, the easier to act and control emotions. The more complex the system, the more you doubt yourself.
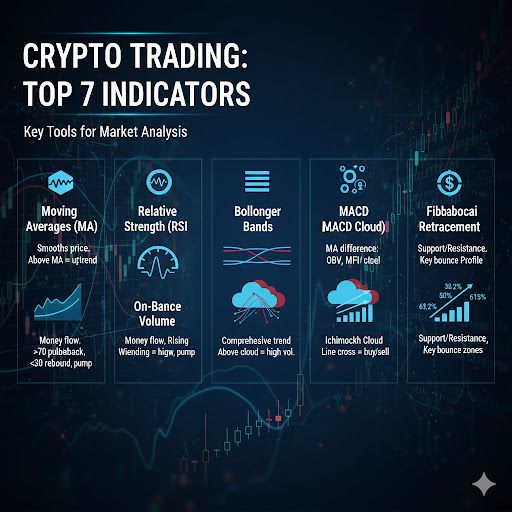
4.Indicators Highly Rated by Experienced Traders
- Moving Averages (MA): smooths price volatility and clarifies trend. Types include SMA, EMA, WMA. EMA reacts faster to crypto price swings. Price above MA indicates uptrend, below MA indicates downtrend.
- Relative Strength Index (RSI): measures momentum using price speed and direction. Above 70 signals potential pullback, below 30 indicates oversold and rebound potential.
- Bollinger Bands: measures volatility around a MA. Upper/lower bands indicate overbought/oversold. Bands widening → high volatility, narrowing → sideways.
- On-Balance Volume (OBV): shows the relationship between price and trading volume. Rising OBV → strong inflow, potential pump; falling OBV → outflow, potential dump.
- Ichimoku Cloud: comprehensive tool with cloud (kumo), leading spans, and baseline. Price above cloud → uptrend; below → downtrend. Thick cloud → high volatility, potential breakout.
- MACD: difference between two MAs identifies trade opportunities. MACD line crossing signal line → buy/sell. Histogram intensity indicates momentum strength.
- Fibonacci Retracement: identifies potential support/resistance levels. Levels 38.2%, 50%, 61.8% often act as bounce zones during pullbacks.
5. Conclusion
Indicators are tools, not solutions. Traders fail when they rely on indicators for certainty. Successful traders use indicators to increase probability and reinforce discipline. An indicator only matters if it provides meaningful, actionable information, supporting objective decision-making.
Keep It Simple, Stupid. If an indicator confuses you, remove it. If it clarifies the market, keep and optimize it. No strategy or indicator is perfect. Only traders who understand what they are doing succeed.
Disclaimer: This content does not constitute investment, tax, legal, financial, or accounting advice. MEXC provides this information for educational purposes only. Always do your own research, understand the risks, and invest responsibly.
Join MEXC and Get up to $10,000 Bonus!
Sign Up


