While retail celebrates record stablecoin supply as ultimate bullish indicator, professional analysis reveals a more complex distribution and risk management story.

Record-breaking headlines tend to generate predictable reactions in cryptocurrency markets. This week’s announcement that stablecoin supply has reached an all-time high of $283.2 billion, accompanied by 25.2 million monthly active users, has sparked the familiar refrain across social media and retail trading communities: massive buying power is building on the sidelines, ready to fuel the next major rally.
Professional traders and institutional analysts, however, are interpreting this milestone through a fundamentally different lens. For seasoned market participants, record stablecoin supply represents something far more nuanced than simple accumulation of buying power, it potentially signals a sophisticated distribution process and defensive positioning by the market’s most informed participants.
This analytical disconnect between retail enthusiasm and professional caution deserves closer examination, particularly given the historical relationship between stablecoin supply peaks and subsequent market behavior.
1.The Mainstream Narrative: “Cash on the Sidelines”
The prevailing retail interpretation of massive stablecoin supply rests on a straightforward premise: investors have converted volatile cryptocurrencies into stable assets and are now waiting for optimal entry points to redeploy that capital. Under this framework, $283.2 billion represents unprecedented buying power that will inevitably flow back into risk assets, creating sustained upward pressure on cryptocurrency prices.
Figure 1: Total Stablecoin Supply Growth (2018-2025)
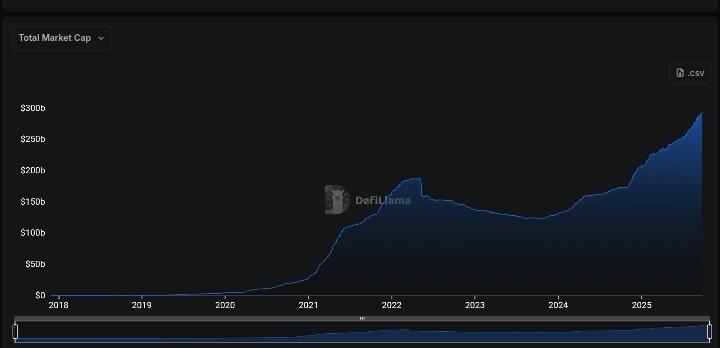
According to DefiLlama data, total stablecoin supply has grown from approximately $45 billion in early 2020 to the current record of $283.2 billion, a more than 6x increase over five years. The steepest growth occurred during the 2021 bull market, when supply expanded from roughly $70 billion to over $180 billion, coinciding with Bitcoin’s rally to all-time highs.
This interpretation gains superficial credibility from the accompanying user growth data. With 25.2 million monthly active stablecoin users representing a significant expansion in market participation, the narrative suggests broader adoption is driving both supply growth and future demand potential.
Social media sentiment analysis and retail trading forums consistently echo this optimistic interpretation, treating stablecoin supply growth as a leading indicator of impending bullish momentum. The logic appears sound: more stable capital plus more participants should equal more buying pressure.
However, this surface-level analysis fails to account for the composition, timing, and strategic purposes behind stablecoin accumulation, factors that professional traders consider essential for accurate market interpretation.
2.Professional Analysis: Distribution Signal, Not Accumulation
Institutional traders and professional market makers approach stablecoin supply data with significantly greater sophistication, recognizing that the source and intent behind capital flows matter more than absolute volumes. From this perspective, record stablecoin supply often indicates profit-taking and defensive positioning rather than aggressive accumulation strategies.
2.1 The Distribution Hypothesis
Large-scale conversion to stablecoins frequently occurs during late-stage bull market phases when sophisticated participants begin systematically reducing exposure to volatile assets. This process, known as distribution, involves gradual profit-taking disguised within overall market strength, a phenomenon that can persist for weeks or months before broader market participants recognize the shift.
Figure 2: Stablecoin Supply vs Bitcoin Price Correlation Analysis
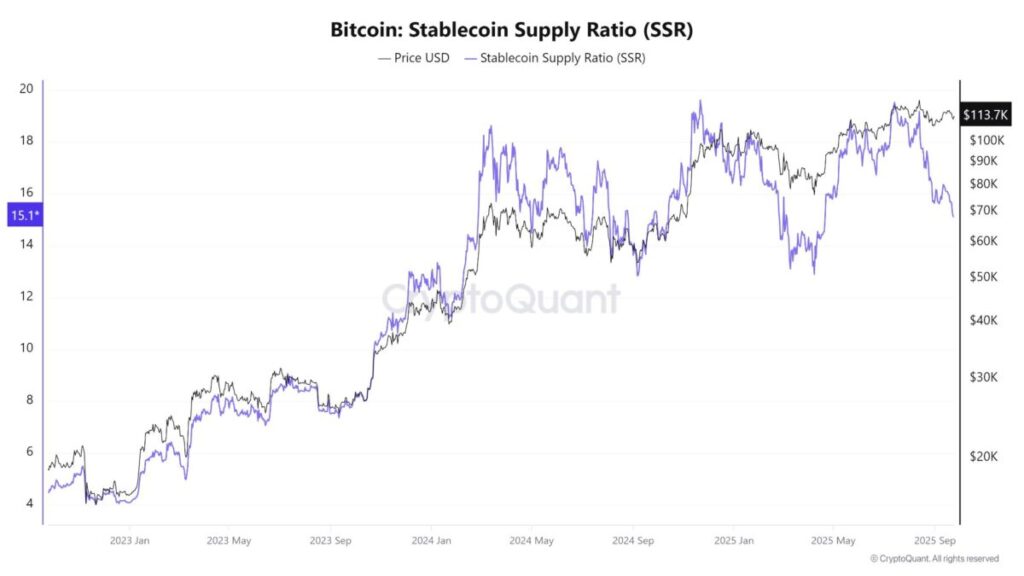
Professional analysis of previous stablecoin supply peaks reveals a consistent pattern: major increases in stable asset holdings often precede or coincide with local market tops rather than bottoms. This counterintuitive relationship reflects the behavioral dynamics of institutional capital allocation during different market phases.
2.2 Institutional “Parking Lot” Strategy
For professional trading operations, stablecoins serve multiple strategic functions beyond simple speculation:
- Profit Securitization: Following successful trading periods or major rallies, institutions systematically convert portions of gains into stablecoins to lock in returns while maintaining crypto ecosystem exposure. Record supply levels suggest significant profit-taking has occurred across professional trading desks.
- Volatility Management: Large trading operations use stablecoin positions as tactical hedges against sudden market downturns or regulatory developments. Increased stablecoin allocation often reflects heightened concern about downside risks rather than preparation for upside participation.
- Liquidity Facilitation: Over-the-counter trading desks and institutional market makers require substantial stablecoin reserves to facilitate large-scale transactions and arbitrage operations. Supply growth may simply reflect expanded institutional trading infrastructure rather than retail buying power accumulation.
2.3 Historical Context: Supply Peaks and Market Timing
Empirical analysis of stablecoin supply behavior across previous market cycles provides crucial context for interpreting current data. Historical patterns consistently show stablecoin supply expansion during market strength followed by gradual deployment during subsequent corrections, the inverse of retail expectations.
Figure 3: Historical Stablecoin Supply Peaks vs Subsequent Market Performance
Table showing major stablecoin supply milestones and Bitcoin performance over following 30, 60, and 90-day periods
| Peak (supply) | Supply (USD) | BTC price at peak (USD) | BTC +30d % | BTC +60d % | BTC +90d % |
| Oct 18, 2021 | $127.9B | $62,026.08 (BTC close 2021-10-18). | −2.72% (Nov 17, 2021 close $60,338.45) | −25.38% (Dec 17, 2021 close $46,286.14) | −30.35% (Jan 16, 2022 close $43,203.21). |
| March 2022 | $181.7B (USD-pegged stablecoins peaked in March 2022 per CoinGecko report). | $45,823.71 (BTC close 2022-03-31). | −17.56% (30d: 2022-04-30 close $37,776.98) | −30.78% (60d: 2022-05-30 close $31,719.36) | −55.69% (90d: 2022-06-29 close $20,302.68). |
| June 18, 2025 | $251.7B | $104,806.11 (BTC close 2025-06-18) | +13.81% (30d: 2025-07-18 close $119,284.11) | +12.10% (60d: 2025-08-17 close ≈ $117,492.79). | +11.47% (90d: 2025-09-16 close $116,827.50). |
2.4 From the peaks analyzed
Oct 2021 peak (~$128B supply)
Supply growth coincided with BTC near ATH levels.
Next 90 days, BTC dropped ~30%.
Supply expanded while BTC was strong, but once the market topped, that supply wasn’t instantly deployed to defend prices.
March 2022 peak (~$182B supply)
This was the largest historical supply up to then. BTC was ~$45K.
Next 90 days, BTC collapsed ~56%.
Supply kept expanding even into weakness, but it reflected systemic inflows and redemptions lagging market momentum. It was not an immediate bullish trigger.
June 2025 peak (~$252B supply, all-time high)
BTC was ~$105K. Over the next 30–90 days BTC gained ~11–14%.
In this case, supply expansion was aligned with strength and didn’t reverse. But importantly, the “buying” wasn’t instant, supply expanded with the trend, then deployment into BTC followed gradually.
This pattern suggests that stablecoin supply serves as a contrary indicator during late-cycle phases, rising as smart money becomes increasingly defensive while retail participants interpret strength as validation for continued bullish positioning.
2.5 Composition Analysis: Who Holds What, and Why It Matters
Professional market analysis requires understanding not just aggregate stablecoin supply, but its composition across different asset types and holding patterns. The $283.2 billion total encompasses various stablecoin types with distinct use cases and user demographics.
Figure 4: Stablecoin Market Share Breakdown
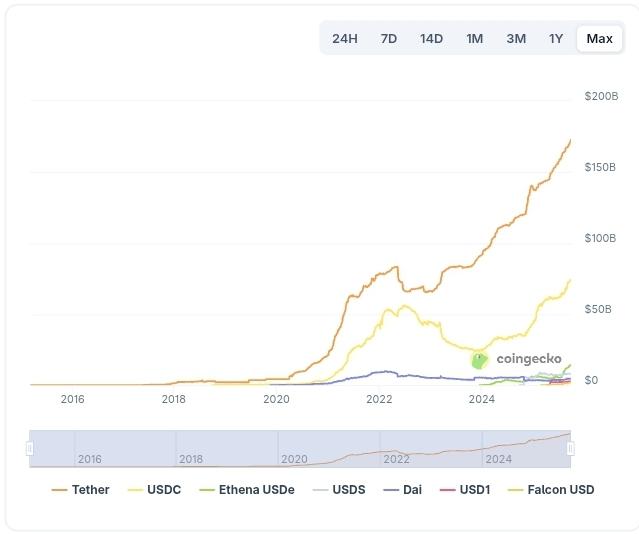
- USDT Dominance Implications: Tether’s continued market leadership reflects its entrenchment in professional trading operations and international arbitrage activities. USDT concentration among institutional traders suggests significant portions of current supply serve operational rather than speculative purposes.
- USDC Growth Patterns: USD Coin’s expansion often correlates with regulated institutional adoption and corporate treasury diversification strategies. Growth in USDC holdings may indicate professional capital allocation rather than retail speculation.
- Exchange Reserve Analysis: The distribution of stablecoin holdings across centralized exchanges versus decentralized finance protocols provides insight into deployment intentions. High exchange concentrations typically indicate active trading preparation, while DeFi stablecoin deployment suggests yield-seeking behavior rather than directional speculation.
3.Risk Assessment: What Record Supply Actually Signals
From a professional risk management perspective, record stablecoin supply introduces several considerations that contradict the mainstream bullish interpretation:
- Liquidity Overhang Risk: Massive stablecoin positions represent potential selling pressure that can be rapidly deployed during market stress. While retail interprets this as buying power, professionals recognize it as potential supply that could exacerbate downward moves if market sentiment shifts.
- Concentration Risk: Large stablecoin holdings concentrated among sophisticated participants create systemic risks if coordinated deployment occurs. Professional traders understand that institutional positioning changes can trigger cascading market effects that retail analysis typically underestimates.
- Timing Risk: The buildup of defensive positioning through stablecoin accumulation often precedes rather than follows major market corrections. Professional analysis treats supply peaks as potential distribution signals requiring increased caution rather than aggressive positioning.
4.Market Structure Implications
The evolution toward record stablecoin supply reflects fundamental changes in cryptocurrency market structure that extend beyond simple supply and demand dynamics:
- Institutional Infrastructure Maturation: Growing stablecoin adoption indicates expanding professional trading infrastructure and institutional participation. However, this sophistication can increase market efficiency in ways that reduce rather than enhance opportunities for retail participants.
- Professional Capital Allocation: Increased institutional presence brings more sophisticated risk management practices that prioritize capital preservation over speculation. Record stablecoin supply may reflect this professional approach to market participation rather than speculative accumulation.
- Market Cycle Evolution: As cryptocurrency markets mature, traditional retail-driven boom-bust cycles may evolve into more complex institutional distribution patterns. Current stablecoin dynamics potentially signal this structural transition rather than preparation for traditional rally phases.
5.Contrarian Investment Implications
For traders and investors capable of thinking beyond consensus narratives, record stablecoin supply suggests several contrarian considerations:
- Defensive Positioning: Rather than aggressive accumulation, current market conditions may warrant increased caution and defensive positioning similar to professional participants who have already rotated into stable assets.
- Timeline Expectations: If stablecoin supply reflects distribution rather than accumulation, subsequent market weakness may persist longer than retail expectations anticipate, creating extended opportunities for patient capital deployment.
- Contrary Deployment: Optimal investment timing may occur when stablecoin supply begins declining rather than when it reaches peaks, indicating that professional capital is moving from defensive to aggressive positioning.
6.Conclusion: Reading Between the Lines
The milestone of $283.2 billion in stablecoin supply represents far more than a simple accumulation of buying power waiting to fuel the next rally. Professional market analysis suggests this development may actually signal sophisticated distribution and defensive positioning by the market’s most informed participants.
While retail sentiment celebrates record stablecoin supply as ultimate validation of bullish prospects, historical patterns and institutional behavior analysis point toward a more complex reality. Previous stablecoin supply peaks have consistently preceded rather than followed major market corrections, reflecting the tendency of professional participants to rotate into defensive assets during late-cycle market phases.
The divergence between retail interpretation and professional analysis of stablecoin data illustrates a broader pattern in cryptocurrency markets: surface-level metrics often provide misleading signals when divorced from proper context and historical perspective. Successful market participation requires understanding not just what is happening, but why it is happening and who is driving those changes.
For traders and investors seeking sustainable market advantage, the record stablecoin supply milestone serves as a reminder that contrarian thinking and professional-level analysis often provide superior insights compared to consensus narratives and social media sentiment. In markets driven by narrative and emotion, the ability to interpret data through institutional lenses rather than retail expectations may prove increasingly valuable for long-term success.
Trade with professional insights on MEXC Global, where advanced market data helps you cut through surface narratives and spot structural shifts early.
Disclaimer: This content is for educational and reference purposes only and does not constitute investment advice. Digital asset investments carry high risk. Please evaluate carefully and assume full responsibility for your own decisions.
Join MEXC and Get up to $10,000 Bonus!


