
Bitcoin is at a crossroads. After reaching an all-time high above $126,000 in early October, the world’s largest cryptocurrency has shed over 15% of its value and now hovers precariously around $107,000-$108,000. The psychological $100,000 level; once a dream target for bulls, has become the line in the sand that will determine whether Bitcoin’s 2025 bull run continues or enters a dangerous correction phase.
For traders, this isn’t just another dip. It’s a critical technical juncture where the wrong move could mean watching Bitcoin plunge toward $90,000 or lower. Conversely, a successful defense of support could set up the year-end rally that bulls have been anticipating.
1. The Technical Battlefield: Key Levels That Matter
Understanding Bitcoin’s current technical setup is essential for navigating what comes next.
Support Structure
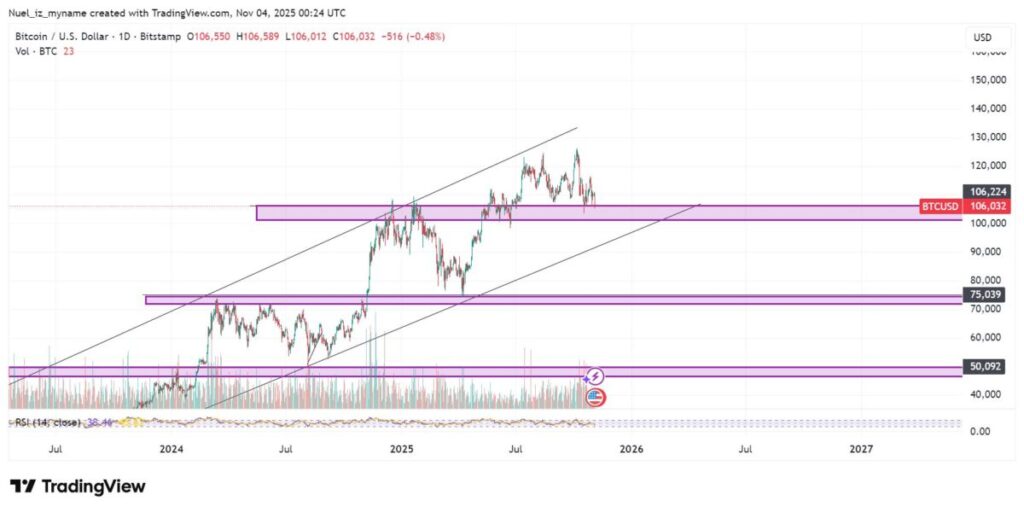
The immediate support zone sits at $108,000-$110,000. Bitcoin must sustain above this base to maintain its bullish structure. A decisive close below $108,000 would trigger a correction toward $104,000-$106,000, where longer-term holders have historically stepped in.
The psychological $100,000 level looms as the ultimate line in the sand. A monthly close below six figures would signal a potential regime change from bull market to correction phase. Some technicians point to the 50-week simple moving average around $101,700 as critical, Bitcoin hasn’t closed below this level since Q1 2023.
If $100,000 fails, the next major support appears at $98,000, with some bearish analysts warning of potential drops toward $90,000.
Resistance Challenge
On the upside, Bitcoin faces significant resistance at $116,000-$118,000. A breakout past this range would reignite bullish momentum and could lift prices toward $125,000-$128,000, potentially retesting October’s all-time highs.
The path above $118,000 opens relatively clear price discovery toward $130,000-$135,000 realistic year-end targets if Bitcoin reclaims momentum. However, this requires first overcoming immediate resistance that has repeatedly rejected price.
Technical indicators send mixed signals. The RSI shows oversold conditions suggesting a relief bounce, but the flattening MACD indicates weak momentum and lacking conviction.
2. Why This Matters: The Bull Market Hangs in the Balance
Bitcoin’s current price action isn’t just about short-term ranges, it’s about whether the 2023-2025 bull market remains intact
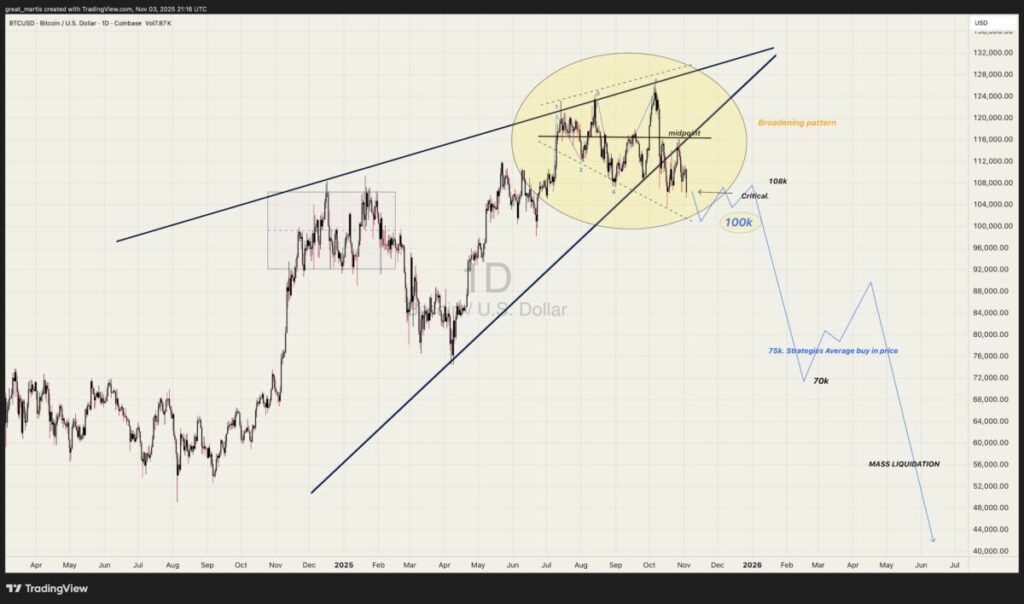
Bitcoin’s weekly chart displays a rising wedge pattern; a bearish formation characterized by converging trendlines indicating waning momentum. In previous cycles, this setup resulted in 15-35% declines. The pattern suggests bulls struggle to push higher with conviction while bears haven’t broken support decisively. This standoff typically resolves soon—and violently.
Multiple analysts believe mid-November could mark a local bottom before a year-end rally, based on the projected intersection of the 50-day and 200-day moving averages, which has historically marked past local bottoms in bull markets.
One crucial factor distinguishes 2025 from previous corrections: institutional infrastructure. Bitcoin spot ETFs continue to hold over $110 billion in assets. Unlike previous cycles where retail panic drove cascading selloffs, institutional buyers provide natural demand at lower levels. However, if major players reduce exposure or ETF outflows accelerate, this safety net could evaporate quickly.
3. What Traders Need to Watch: Key Catalysts Ahead
Several factors will determine whether Bitcoin holds $100,000 or breaks lower.
Federal Reserve Policy
Recent Fed statements hint at no further rate cuts in December, strengthening the dollar and lifting Treasury yields—typically negative for Bitcoin. However, paradoxically, policy clarity could remove uncertainty and support Bitcoin once traders can position accordingly.
On-Chain Signals
Despite price weakness, on-chain data shows 231 new whale wallets accumulating in the $108,000-$110,000 range, while approximately 37,000 smaller holders exit. This divergence between smart money accumulating and retail exiting often signals bottoms forming.
Bitcoin’s realized capitalization remains above $1.1 trillion with stable on-chain activity, suggesting that despite volatility, fundamental network value remains solid.
Stablecoin Positioning
Stablecoins now represent nearly 3% of total crypto market cap, with demand rising. This isn’t bearish—it’s strategic positioning. Capital hasn’t fled; it’s waiting on the sidelines for better entry points.
4. The Bull Case: Why $100K Could Hold
Several factors support the argument that $100,000 will hold.
Bitcoin’s April 2024 halving cut supply issuance by 50%. Historically, the strongest appreciation occurs 12-18 months post-halving, the window we’re entering now. Previous cycles peaked approximately 18 months after halvings.
Long-term holder composition remains strong, with most supply held in wallets unchanged for over a year. Unrealized losses at current levels represent just 1.3% of market cap, suggesting most holders remain in profit and unlikely to panic.
The presence of regulated ETFs and institutional custody provides support mechanisms absent in previous cycles. Major institutions have staked reputations on Bitcoin products and are unlikely to abandon positions during routine corrections.
Historically, Bitcoin continues recording higher lows within an ascending channel dating to 2022. Bounces from this channel’s lower range have delivered 60-170% returns. If the pattern holds, current levels represent opportunity, not breakdown.
5. The Bear Case: Why Further Downside Looms
Legitimate risks could drive Bitcoin below $100,000 and potentially much lower.
The rising wedge breakdown risk is real. When these patterns resolve, they often do so violently downward. A 20% correction from $108,000 targets $86,000, well below $100,000 support.
Each rally attempt since October’s ATH has produced lower highs, indicating waning buying pressure. This bearish momentum often precedes larger corrections as bulls surrender and bears gain confidence.
Macro headwinds persist. A strengthening dollar typically correlates inversely with Bitcoin. If the Fed maintains “higher for longer” rates and the dollar strengthens further, it creates persistent headwinds.
Despite October’s liquidations, futures open interest remains elevated, creating potential for another forced-selling wave if prices drop toward liquidation clusters around $100,000-$102,000.
6. The Verdict: What’s Next
Bitcoin stands at a genuine inflection point. If it holds support above $108,000 and reclaims $116,000-$118,000 resistance, it confirms October was simply a healthy pullback within an ongoing bull market. This opens paths toward $125,000-$145,000 into year-end.
Conversely, a weekly or monthly close below $100,000 signals bull market structure breaking down. The next major support appears at $98,000, and if that fails, $90,000 becomes the target; triggering months of sideways or downward action.
Based on institutional infrastructure, post-halving dynamics, whale accumulation, and historical patterns, odds favor Bitcoin holding support and resuming uptrend. However, volatility will remain extreme with sharp moves testing both sides.
7. Action Items for Traders
For Bulls:
– Watch $108,000, multiple defenses increase confidence
– Wait for daily close above $112,000-$113,000 for confirmation
– Scale into positions gradually rather than all-in
– Set stops below $106,000 weekly close
For Bears:
– Wait for confirmed breakdown below $106,000-$108,000
– Target $100,000 test if support breaks
– Watch for capitulation with extreme fear and volume spikes
– Be ready to flip if $100,000 holds strongly
For Everyone:
– Reduce leverage in current volatility
– Monitor Fed policy, geopolitical events, economic data
– Track whale accumulation and exchange flows
– Keep perspective, even $90,000-$98,000 remains long-term uptrend
8. Conclusion
Bitcoin’s moment of truth has arrived. After months of consolidation and violent October correction, the market is being forced to decide: Is $100,000 the floor or just another level to break?
November has historically been Bitcoin’s most decisive month. This November will likely live up to that reputation. The question isn’t which direction Bitcoin moves, it’s whether you’ll be positioned to profit when it does.
The $100,000 test will define whether 2025 ends at $145,000 or $85,000. Both are possible. Your job isn’t predicting which; it’s preparing for both and reacting when the market shows its hand.
The test is now. And Bitcoin’s future hangs in the balance.
Disclaimer: This content is for educational and reference purposes only and does not constitute investment advice. Digital asset investments carry high risk. Please evaluate carefully and assume full responsibility for your own decisions.
Join MEXC and Get up to $10,000 Bonus!


